
Area of Impact
Climate Change
Indicator
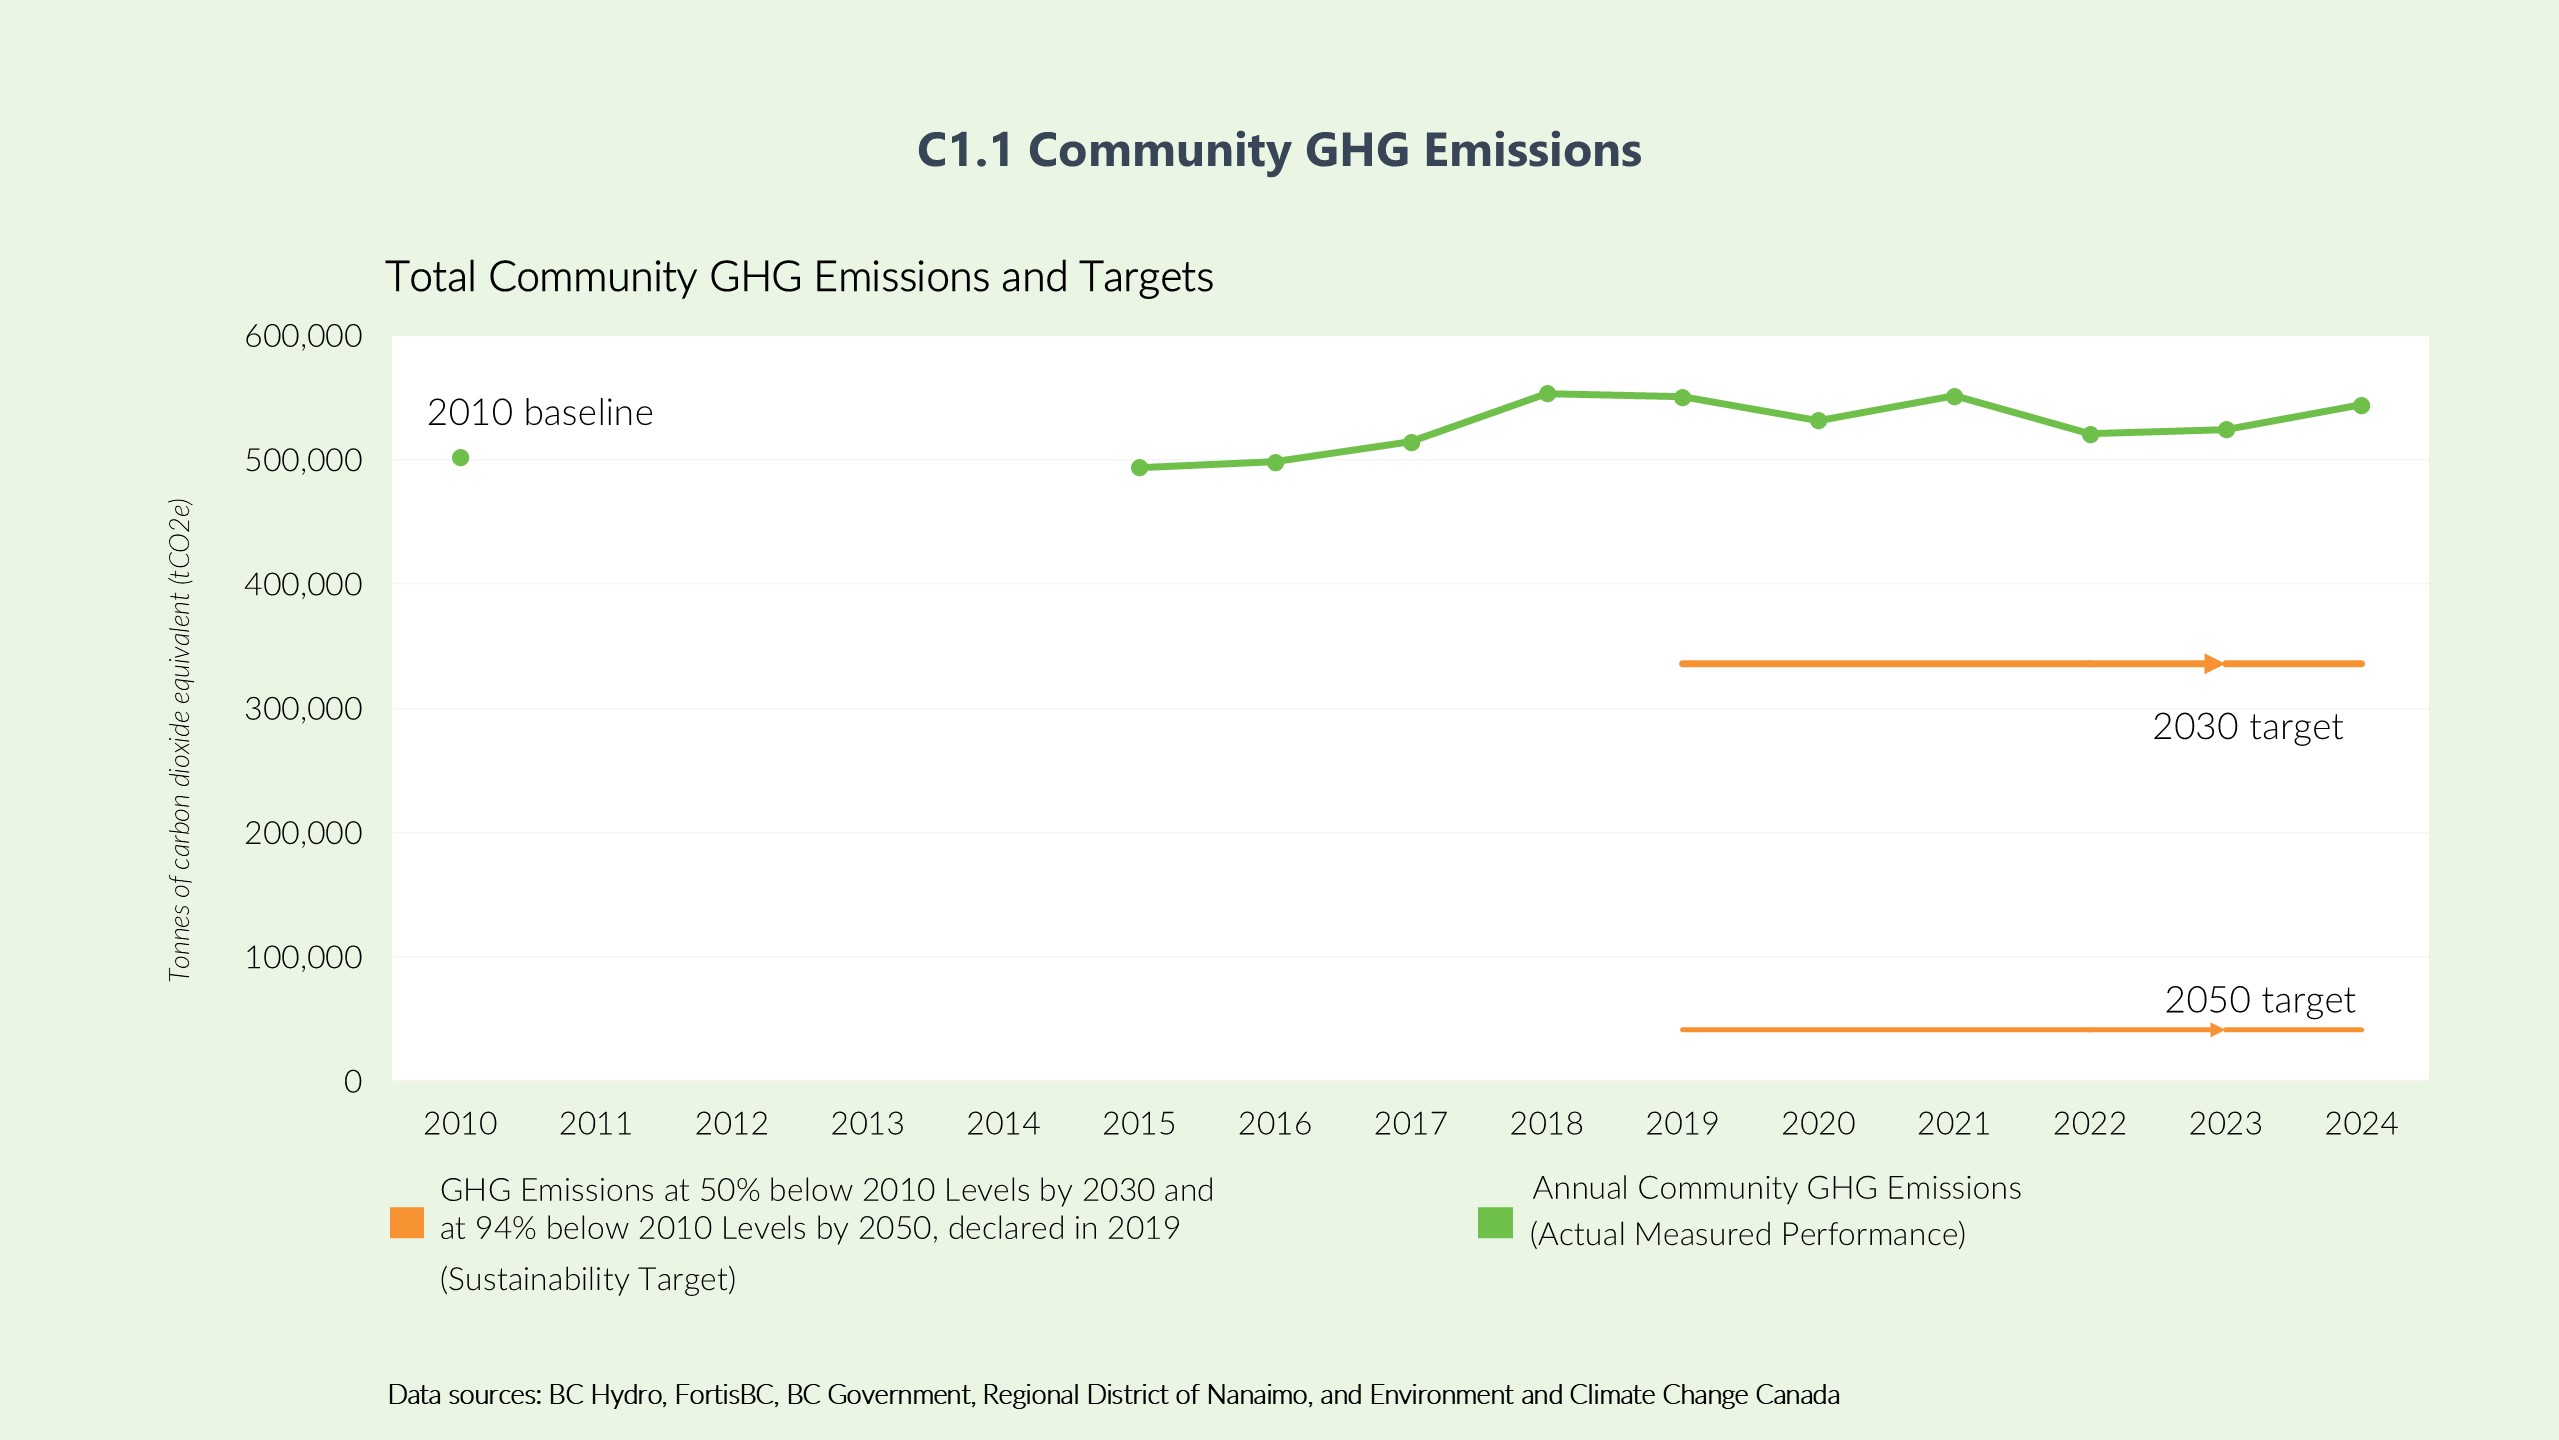
Community GHG emissions (tCO2e)
Reporting Period Data
| Period | Data |
|---|---|
| 2015 | 493,975 |
| 2016 | 498,356 |
| 2017 | 514,443 |
| 2018 | 553,474 |
| 2019 | 550,648 |
| 2020 | 531,875 |
| 2021 | 551,456 |
| 2022 | 520,933 |
| 2023 | 524,251 |
| 2024 | 544,287 |
Target
50%-58% below 2010 levels by 2030; 94%-107% below 2010 levels by 2050.Indicator Data
Give feedback on accessibility. Submit your feedback through our online accessibility feedback form. Help us understand barriers people face when accessing City services.
You can attach files to help explain the barrier you faced in the form, like: a video, voice recording or photos. If American Sign Language (ASL) is the best way for you to communicate, upload a video of yourself using ASL into the form.
Please include: what you were trying to access, where the barrier happened, what the barrier was and any recommendations you might have.
Help us improve our website
Important Information About Privacy
Information collected on this form is done so under the general authority of the Community Charter and Freedom of Information and Privacy Protection Act (FOIPPA), and is protected in accordance with FOIPPA. Personal information will only be used by authorized staff to fulfill the purpose for which it was originally collected, or for a use consistent with that purpose.
For further information regarding the collection, use, or disclosure of personal information, please contact the Legislative Services Office at 250-755-4405 or at foi@nanaimo.ca
-
Parks, Rec & Culture
- Recreation Facilities & Schedules
- Parks & Trails
- Trails
- Activity Guide
- Events
- Register for a Program
- Drop-In Schedules
- Public Art
- Culture
- Poetry
-
City Services
- Garbage & Recycling
-
Home & Property
- Change Your Address
- Damage/Injury Claims
- City Charges and Your Property Title
- Pre-Authorized Withdrawals (PAWS)
- Property Taxes
- User Rates
- Dog Licences
- Payment Options
- MyCity
- Water & Sewage
- Online Services
- Cemetery Services
- City Services Directory
-
Property & Development
- Urban Forestry
-
Building Permits
- Online Building Permit Application
- Building Permit Revision
-
Application for a Residential Building Permit
- Access (driveway) Permit
- Accessory Building Permit
- Alteration Permit
- Building Envelope Repair
- Carriage House
- Demolition Permit
- Fence or Retaining Wall Permit
- Geotechnical Reports
- Locate Permit
- New Construction Permit
- Plumbing or Services Permit
- Secondary Suite Permit
- Special Inspection Permit
- Swimming Pool Permit
- Woodstove Installation Info
- Green Home Initiatives
- Small-Scale Multi-Unit Housing (SSMUH) Permit
-
Apply for a Commercial Building Permit
- Access (driveway) Permit
- Commercial Alteration Permit
- Building Envelope Repair Permit
- Demolition Permit
- Fence or Retaining Wall Permit
- Geotechnical Reports
- Leasehold Improvement
- Locate Permit
- New Commercial Construction Permit
- Occupant Load Permit
- Signs Permit
- Special Inspection Permit
- Sprinkler Requirements
- Fees and Bonding
- Commercial Plumbing Permit
- Certified Professional Program
- Bylaws for Building
- Forms and Guidelines
- Book a Building Inspection
- Report Illegal Construction
- Request Building Plans
- Building Permit Statistics
- Permit Fee Calculator
- Building News and Alerts
- Fast Track Building Permits
- Development Information
- What's Building in my Neighbourhood
- Development Activity Map
- Community Planning
- NanaimoMap
- Rebates
- Engineering Survey
- Land Use Bylaws
- Soil Removal and Depositing
- Heritage Buildings
- Sustainability
- Transportation & Mobility
-
Your Government
- Get Involved
- Government Services Guide
- News & Events
-
City Council
- Advocacy
- Contact Mayor & Council
- Council Meetings
-
Boards & Committees
- Advisory Committee on Accessibility and Inclusiveness
- Board of Variance
- Design Advisory Panel
- Finance and Audit Committee
- Governance and Priorities Committee
- Mayor's Leaders' Table
- Parcel Tax Roll Review Panel
- Special District 68 Sports Field and Recreation Committee
- Public Safety Committee
- Understanding Council Committee Structures
- Council Policies
- Mayor's Office
- Council Initiatives
- Proclamations
- Bastion Lighting Requests
- Flags at City Hall
- Alternative Approval Process
- Budget & Finance
- Records, Information & Privacy
- Elections
- Contacts
- Careers
- Maps & Data
- Projects
- Tourism Nanaimo
- Grants
- Awards
- Accessibility & Inclusion
-
Doing Business
- Economic Development
- Doing Business with the City
- Business Licences
- Filming in Nanaimo
- City Owned Property
- Encroachments onto City Property
- Liquor Licences
- Cannabis Retail
- Business Improvement Areas
- Procurement Services
- About Nanaimo
- Green Initiatives
-
Public Safety
- Social Development
- Public Safety Contacts
- Nanaimo Fire Rescue
- Emergency Management
- Police & Crime Prevention
- City Bylaws
- Community Safety and Wellbeing
- Emergency Services